Note
Go to the end to download the full example code.
12. MSIS Option 12: Lower Atmosphere#
This example demonstrates the analysis of MSIS Option 12, which controls Lower atmospheric influences. This option represents a key physical process that affects atmospheric density variations.
Understanding how this option affects atmospheric structure is important for atmospheric modeling, satellite operations, and space weather applications.
import matplotlib.pyplot as plt
from msis_options_utils import create_option_analysis_figure
Option 12 controls Lower atmospheric influences#
This atmospheric effect includes:
Tropospheric and stratospheric coupling
Lower atmospheric wave propagation
Atmospheric tide generation from below
Coupling between atmospheric regions
This analysis shows how turning OFF this option affects atmospheric density across different dimensions and conditions.
option_index = 12
option_name = "Lower Atmosphere"

fig = create_option_analysis_figure(option_index, option_name)
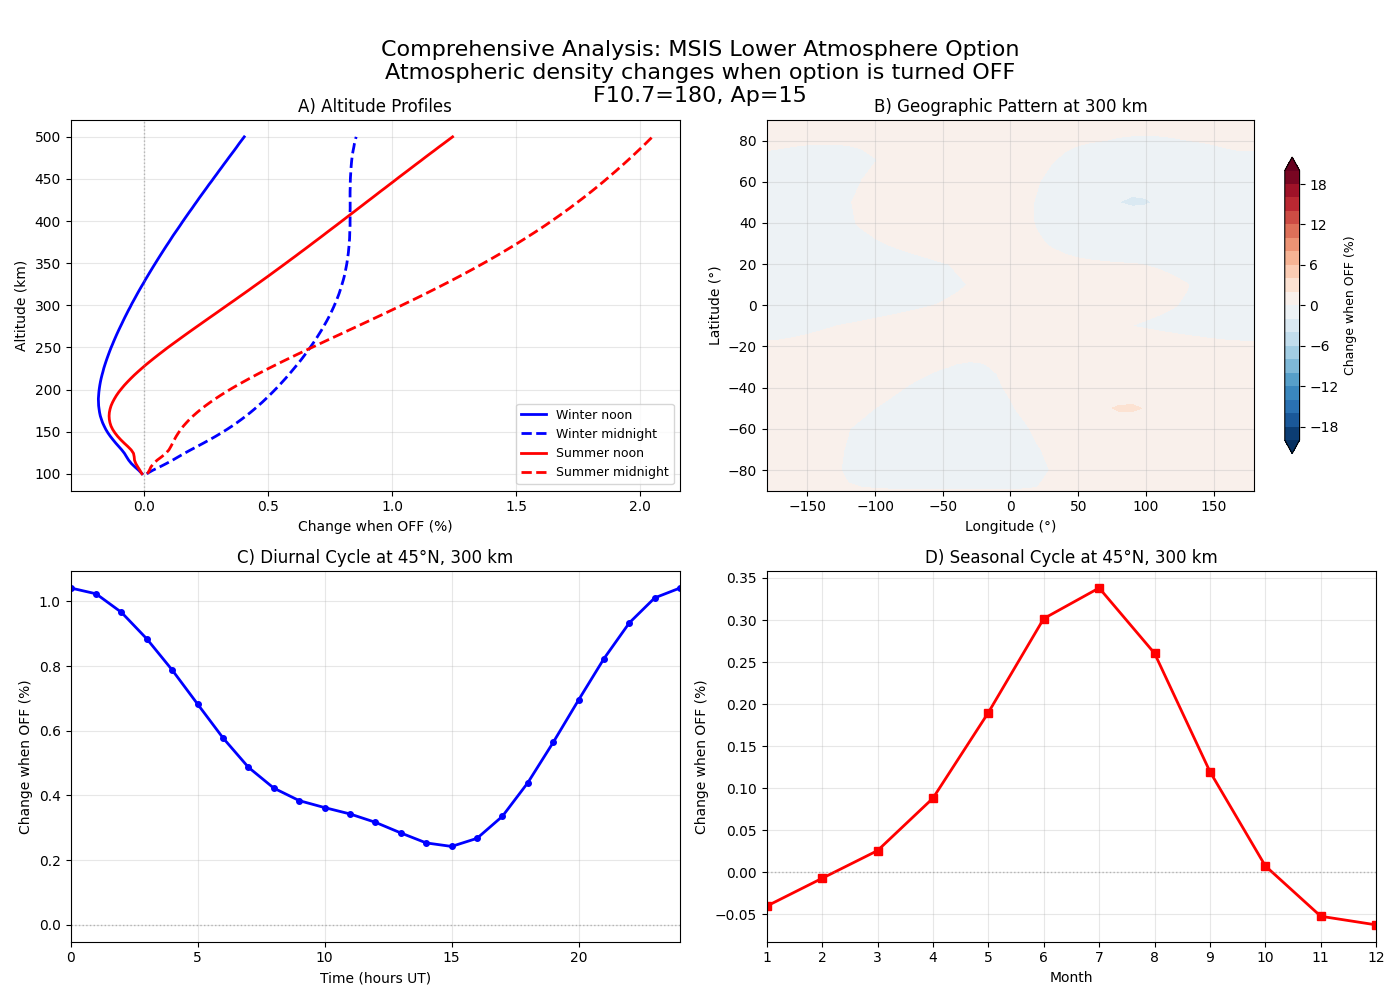
Understanding the Results#
Panel A (Altitude Profiles): Shows how this effect varies with altitude and between different seasonal and diurnal conditions. Look for differences between the four curves to understand temporal variability.
Panel B (Geographic Map): Reveals the global pattern of this atmospheric effect. The contour plot shows percentage changes when the option is turned OFF compared to the baseline (all options ON).
Panel C (Diurnal Cycle): Demonstrates how this effect varies throughout a 24-hour period at a fixed location (45°N, 0°E, 300 km altitude).
Panel D (Seasonal Cycle): Shows how the strength of this effect varies throughout the year, revealing seasonal dependencies.
plt.show()
Physical Importance#
This atmospheric effect is important because:
Important for atmospheric coupling studies
Essential for wave propagation modeling
Critical for complete atmospheric representation
Improves understanding of atmospheric layers interaction
When this option is turned OFF, these physical processes are removed from the atmospheric model, which can significantly impact the accuracy of density predictions depending on the specific application and conditions.
Total running time of the script: (0 minutes 0.774 seconds)