Note
Go to the end to download the full example code.
Diurnal variation#
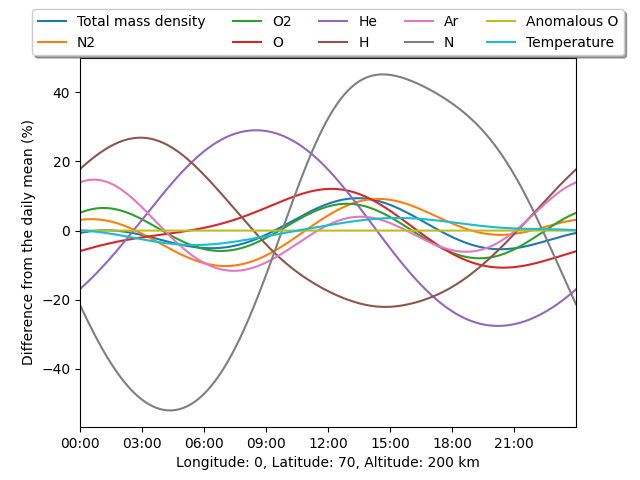
This example demonstrates how to calculate the diurnal variation at a single location.

import matplotlib.dates as mdates
import matplotlib.pyplot as plt
import numpy as np

import pymsis


lon = 0
lat = 70
alt = 200
f107 = 150
f107a = 150
ap = 7
# One years worth of data at the 12th hour every day
dates = np.arange("2003-01-01", "2003-01-02", dtype="datetime64[m]")
ndates = len(dates)
# (F107, F107a, ap) all need to be specified at the same length as dates
f107s = [f107] * ndates
f107as = [f107a] * ndates
aps = [[ap] * 7] * ndates

output = pymsis.calculate(dates, lon, lat, alt, f107s, f107as, aps)
#  output is now of the shape (ndates, 1, 1, 1, 11)
# Get rid of the single dimensions
output = np.squeeze(output)

# Lets get the percent variation from the annual mean for each variable
variation = 100 * (output / output.mean(axis=0) - 1)

_, ax = plt.subplots()
for variable in pymsis.Variable:
    ax.plot(dates, variation[:, variable], label=variable.name)

ax.legend(
    loc="upper center", bbox_to_anchor=(0.5, 1.15), fancybox=True, shadow=True, ncol=5
)
ax.set_xlabel(f"Longitude: {lon}, Latitude: {lat}, Altitude: {alt} km")
ax.set_ylabel("Difference from the daily mean (%)")
ax.set_xlim(dates[0], dates[-1])
ax.xaxis.set_major_locator(mdates.HourLocator(interval=3))
ax.xaxis.set_major_formatter(mdates.DateFormatter("%H:%M"))

plt.show()
Total running time of the script: (0 minutes 0.103 seconds)
