Note
Go to the end to download the full example code.
Surface plot#
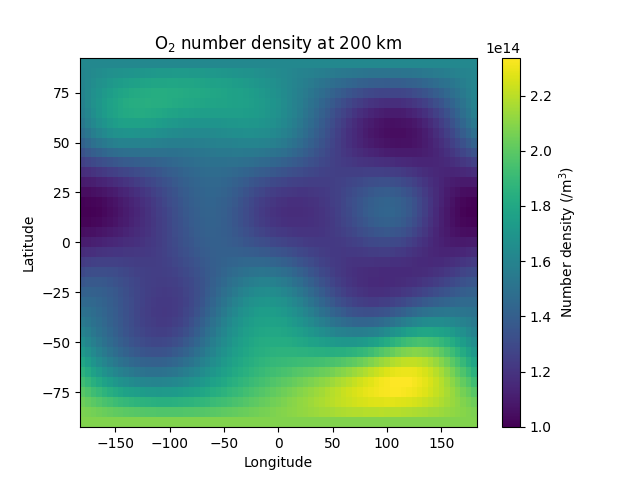
This example demonstrates how to calculate the quantities on a constant altitude plane.

import matplotlib.pyplot as plt
import numpy as np

import pymsis


lons = range(-180, 185, 5)
lats = range(-90, 95, 5)
alt = 200
f107 = 150
f107a = 150
ap = 7
# One years worth of data at the 12th hour every day
date = np.datetime64("2003-01-01T12:00")
aps = [[ap] * 7]

output = pymsis.calculate(date, lons, lats, alt, f107, f107a, aps)
#  output is now of the shape (1, nlons, nlats, 1, 11)
# Get rid of the single dimensions
output = np.squeeze(output)

_, ax = plt.subplots()
xx, yy = np.meshgrid(lons, lats)
mesh = ax.pcolormesh(xx, yy, output[:, :, pymsis.Variable.O2].T, shading="auto")
plt.colorbar(mesh, label="Number density (/m$^3$)")

ax.set_title(f"O$_2$ number density at {alt} km")
ax.set_xlabel("Longitude")
ax.set_ylabel("Latitude")

plt.show()
Total running time of the script: (0 minutes 0.339 seconds)
